Trading MACD Enhanced, July 28, 2008
The parameters were calculated from July 21, 22, 23, 24 and 25 as described one the page Calculating Model Parameters from Minimum Points. The trigger values are shown below:
| symbol | negative trigger value |
|---|---|
| GOOG | -0.565 |
| GS | -0.22 |
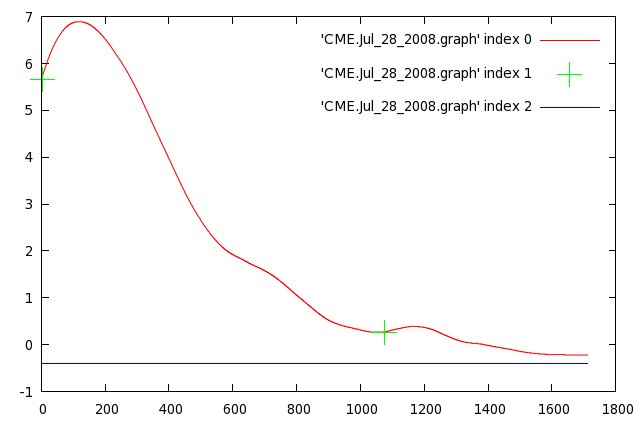
| CME | -0.41 |
| FCX | -0.18 |
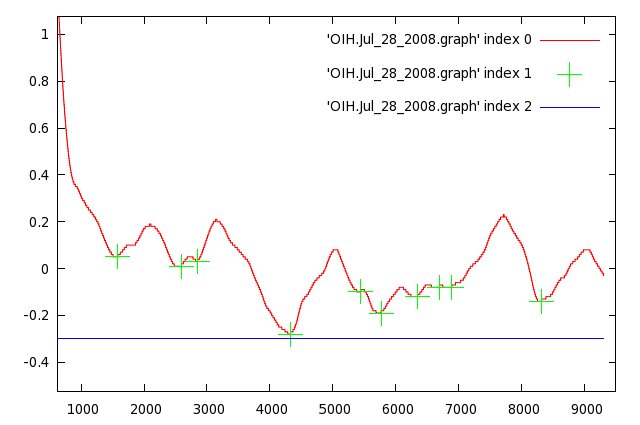
| OIH | -0.3 |
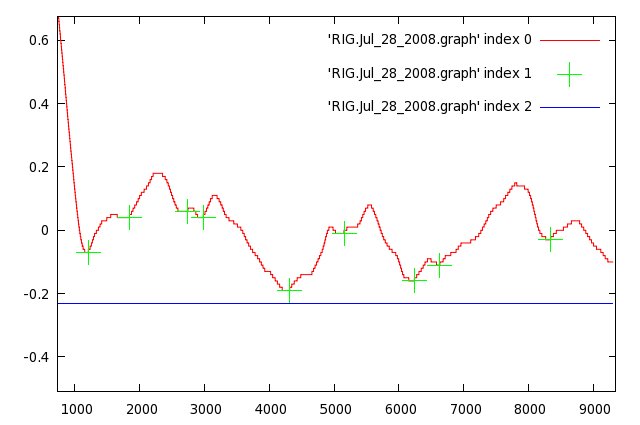
| RIG | -0.23 |
| AMGN | -0.025 |
| BIIB | -0.045 |
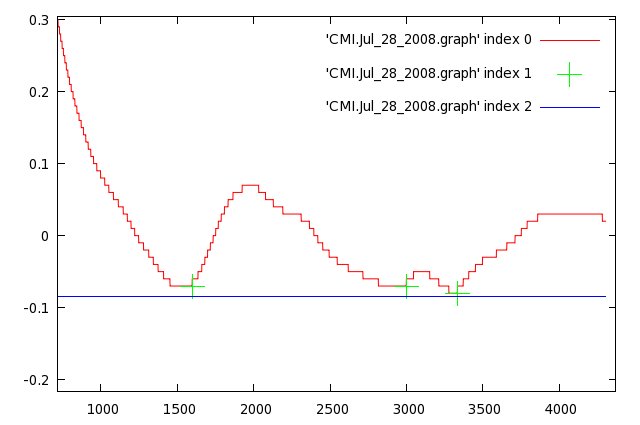
| CMI | -0.085 |
| ERTS | -0.04 |
| ICE | -0.185 |
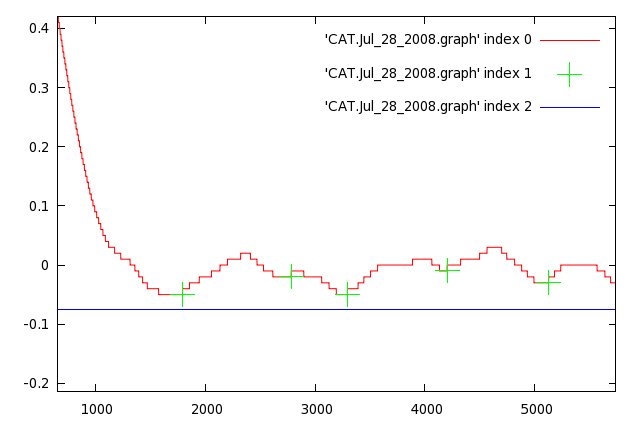
| CAT | -0.075 |
| BBBY | -0.035 |
| BRCM | -0.07 |
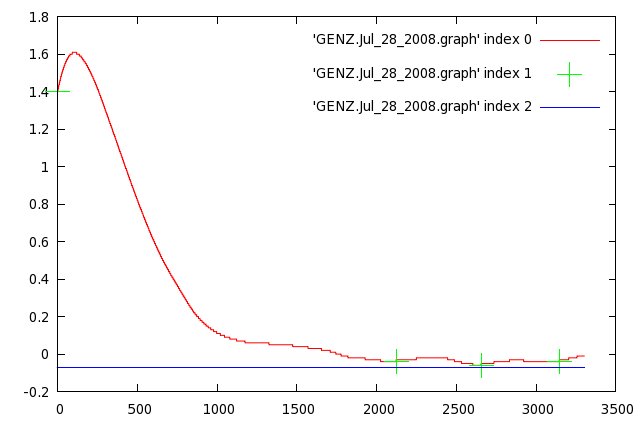
| GENZ | -0.07 |
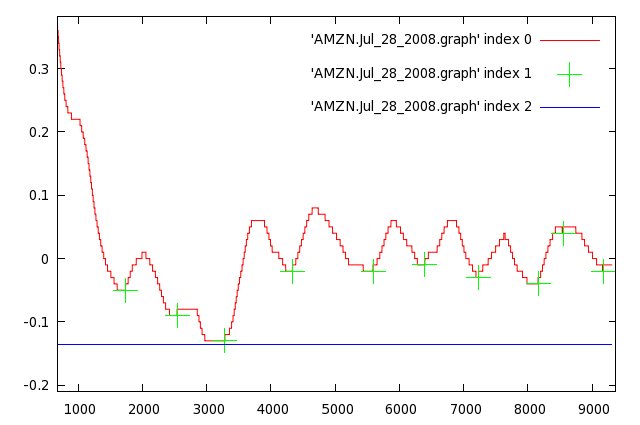
| AMZN | -0.135 |
The list of stocks that was tested in paper trading is shown below. The stocks symbols that are in bold are the stocks that actually traded.
- AMGN
- AMZN
- BBBY
- BIIB
- BRCM
- CAT
- CME
- CMI
- ERTS
- FCX
- GENZ
- GOOG
- GS
- ICE
- OIH
- RIG
The summary of results is shown below. As this shows, trading was at a loss (at least according to the IB paper trading system)
There are a couple of issues
- It appears that the stop was hit more than it should have been. This suggests that the 3*MAD is too low. I'll try 6*MAD tomorrow.
- Half of the stocks didn't trade at all
July 28 trading trace
Graphs showing the signal trade and the calculated minimum line are shown below. Perhaps the minimum should be calculated with fewer days. But the problem with this technique is that inevitably it will not work for some days and will work for others. Note that it works best when there is volatility.